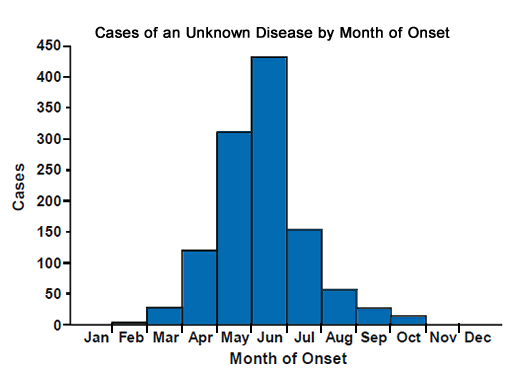
Understanding the Epi-Curve:

The epidemic curve, often referred to as a "time series plot," displays the number of new cases of a specific disease over a designated period, usually plotted against the date of disease onset. This visual representation offers a wealth of information, revealing key characteristics of the outbreak:
- Shape of the Curve:
The shape of the epidemic curve can provide insights into the type of outbreak:
- Point Source: Characterized by a sharp, sudden peak followed by a rapid decline, indicating exposure to a common source, such as contaminated food at a specific event.
- Propagated: Shows a gradual increase in cases over time, followed by a plateau or gradual decline, suggesting person-to-person transmission.
- Mixed: Exhibits a combination of point and propagated patterns, often reflecting multiple sources of infection or transmission chains.
- Peak:
The peak, or highest point of the curve, highlights the period of maximum disease activity. This information is crucial for understanding the intensity and duration of the outbreak.
- Duration:
The overall width of the epidemic curve signifies the duration of the outbreak – the time from the first case to the last. This
- Mode:
The mode corresponds to the most common time of disease onset, providing clues about the likely exposure period.
- Latency Period:
Identifying the time lag between exposure and onset of symptoms sheds light on the incubation period of the disease, aiding in tracing potential sources and preventing further spread.
Utilizing Epi-Curve Analysis:
Epidemic curve analysis plays a vital role in outbreak investigation:
- Identifying Potential Sources:
Examining the shape and time trends of the curve can help narrow down potential sources of exposure, enabling targeted investigations.
- Estimating Outbreak Size and Duration:
Analyzing the peak, duration, and trends can help predict the course of the outbreak and estimate its overall impact.
- Guiding Control Measures:
Understanding the dynamics of the outbreak allows public health officials to implement appropriate control measures, such as isolation, quarantine, vaccination campaigns, or environmental sanitation, at the right time and place.
- Evaluating Effectiveness of Interventions:
Epidemic curves can be used to monitor the effectiveness of implemented control measures by observing changes in trends and ultimately contributing to outbreak containment.
Applications Beyond Outbreaks:
While primarily used for outbreak investigations, epidemic curve analysis has broader applications in public health:
- Monitoring Chronic Diseases:
Tracking disease incidence over time can reveal seasonal patterns, trends, and potential risk factors for chronic diseases.
- Evaluating Population Health Interventions:
Epi-curves can be used to assess the impact of health promotion programs and vaccination campaigns on disease prevalence.
Limitations:
Despite its strengths, epidemic curve analysis also has limitations:
Data Accuracy: The reliability of the analysis depends on accurate and complete reporting of cases.
Asymptomatic Cases:
The curve may underestimate the true extent of an outbreak if a significant proportion of cases are asymptomatic.
- Individual Variability: The incubation period and disease onset time can vary significantly between individuals, potentially obscuring the true pattern of transmission.
FAQs:
- What software can be used for epidemic curve analysis?
Several software programs are available, including Epi Info, R, and SAS.
- Is epidemic curve analysis only used for infectious diseases?
No, it can be used for any condition with a defined onset time, including chronic diseases and injuries.
- How can I interpret different shapes of epidemic curves?
Refer to the "Understanding the Epi-Curve" section for a breakdown of different curve shapes and their interpretations.
- What information should be included in an epidemic curve?
The curve should clearly display the number of cases, date of onset, and title indicating the disease and timeframe.
Conclusion:
Epidemic curve analysis is a vital tool in the arsenal of public health professionals.
Its ability to unveil the trajectory of disease outbreaks allows for informed decision-making, timely interventions, and ultimately, the protection of populations. By understanding the principles and interpreting the language of the epidemic curve, we can better navigate the complexities of disease outbreaks and build a healthier future.
Closure
Thus, we hope this article has provided valuable insights into Epidemic curve analysis. We thank you for taking the time to read this article. See you in our next article!